Building highly interactive honeypots: CVE-2021-41773 case study
Every day, as we drink our coffee in the office, new vulnerabilities pop out, some of which are highly critical and need quick reactions. Exploiting some of these vulnerabilities is a cinch, like the one found in Apache HTTPD “CVE-2021-41773”, which is why they attract many attackers. In such situations, a precise solution is required to get information around the attack as quickly as possible. The gathered information can be used for different goals, for example, to assist security engineers in knowing the attack patterns to defend themselves against it, or maybe for security researchers to gather intel and knowledge as much as possible; therefore, they can share it publicly. One of those solutions is a honeypot. Essentially, a honeypot acts as a decoy-based intrusion detection system to help us detect attacks and their patterns, and defend ourselves against them. This post (or maybe a series of posts) will discuss how to build a highly interactive honeypot for a vulnerability immediately and analyze the generated logs after successful or unsuccessful attacks.
The approach
While numerous honeypot applications are available for free (like dionaea and cowire), these programs attempt to emulate a service and present the attacker with a fake service. Honeypots of this type are effective against autonomic attacks, but they fail to detect manual attacks or attacks with more than one stage. In addition, there are several techniques an attacker can use to uncover a honeypot.
The aforementioned approach has some shortcomings such as limited emulation on specific services and challenging customization. About customization, researchers find it a time-consuming task where in some specific scenarios, they cannot get the advantage of customizatoin. Moreover, it is good to point out that there is no honeypot for dozens of services.
To overcome these hardships, rather than trying to emulate every possible aspect of the faked system, we can grant access to a real system as it is easy, so the attacker has no way of knowing whether they are logged on to a honeypot or not. Securing a real system is not easy; however, it can be done using virtualization or containerization.
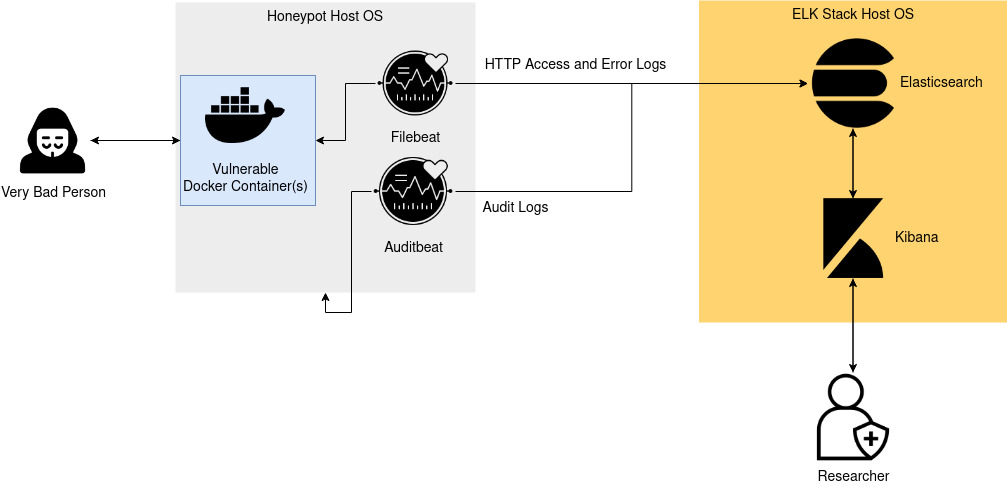
The honeypot is a vulnerable Docker container affected by the CVE-2021-41773. Instances of Filebeat and Auditbeat will collect the logs, and Elasticsearch will colorate them for us. Finally, Kibana can provide a visualized dashboard.
Vuleranble container
A path traversal vulnerability and exploit just dropped in the wild for a specific version of Apache (Apache/2.4.49). This vulnerability allows an unauthenticated attacker to execute a path traversal attack (and now shown RCE if MOD_CGI is enabled) to read files outside the virtual directory path bounds. .
To build a vulnerable container for these types of vulnerabilities, we need the source code of that specific vulnerable version. Luckily, there is a mirror of Apache HTTPD at here!. After downloading the source code, we compile the vulnerable version and build a docker image we can deploy quickly.
The assumption is you know how to install and use Docker; if you’re not familiar, please take a look at This Article!.
Let’s take a look at the content of the Dockerfile:
FROM ubuntu:20.04

MAINTAINER lopqto <[email protected]>

# Install the required packages
RUN apt-get update  && apt-get install -y \
    build-essential zlibc libapr1-dev \
    libaprutil1-dev libpcre3-dev zlib1g zlib1g-dev wget \
    subversion python3 autoconf libtool-bin

WORKDIR /honeypot

# Download the vulnerable version
RUN wget https://github.com/apache/httpd/archive/refs/tags/2.4.49.tar.gz \
    && tar -xvf 2.4.49.tar.gz

WORKDIR /honeypot/httpd-2.4.49/

# Compile the vulenrable version
RUN svn co http://svn.apache.org/repos/asf/apr/apr/trunk srclib/apr \
    && ./buildconf \
    && ./configure --prefix=/usr/local/apache2 \
    --enable-mods-shared=all --enable-deflate --enable-proxy \
    --enable-proxy-balancer --enable-proxy-http \
    && make && make install

RUN mkdir -p /var/www/html && mkdir /var/log/apache2/

# Update the required permissions for www-data
RUN chown -hR www-data:www-data /var/www/html \
    && chown -hR www-data:www-data /var/log/apache2/ \
    && chown -hR www-data:www-data /usr/local/apache2/logs/

USER www-data

WORKDIR /var/www/html

# Run apache in foreground mode
ENTRYPOINT ["/usr/local/apache2/bin/apachectl", "-D", "FOREGROUND"]
To build the vulnerable image:
docker build . -t honeypot:latest
Test the vulnerable container
The vulnerability requires specific permissions to be configured. Grab the default httpd.conf file and append these lines end of it:
<VirtualHost *:8080>
	DocumentRoot /var/www/html

	ErrorLog /var/log/apache2/error.log
	CustomLog /var/log/apache2/access.log combined

	<Directory />
		Require all granted
	</Directory>
</VirtualHost>
Then try to run the vulnerable container with the new config file:
docker run -p 80:8080 \
    -v $(pwd)/httpd.conf:/usr/local/apache2/conf/httpd.conf \
    apache:latest
Test the vulnerability by running:
curl http://localhost/cgi-bin/.%2e/.%2e/.%2e/.%2e/bin/sh -d 'echo;whoami'
You should see www-data in output.

Logging
The Elasticsearch ELK stack (Elasticsearch, Logstash, and Kibana) is an ideal solution for search and analytics platforms on honeypot logs.
There are various how-to’s describing how to get ELK running (see here and here for example), so I assume you already have a working ELK system.
HTTP requests logs
A logger with these advantages is needed:
- No need to modify the container’s configuration
- Prevent attackers from disabling the logger within the container
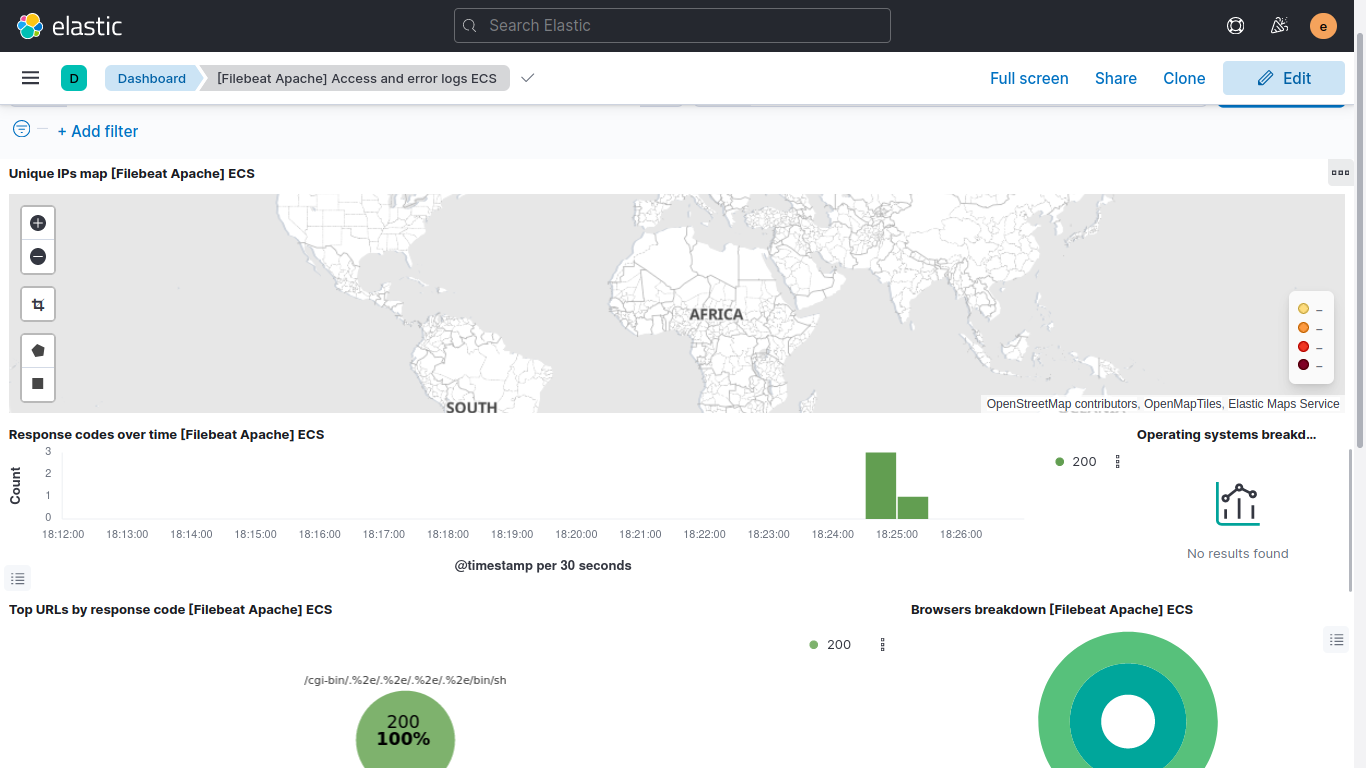
By default, Apache stores the access logs inside /var/log/apache2/access.log and error logs inside /var/log/apache2/error.log. We need to export these logs from the container and store them inside an ElasticSearch instance. To do this, we will use Filebeat:
Filebeat is a lightweight shipper for forwarding and centralizing log data. Installed as an agent on your servers, Filebeat monitors the log files or locations that you specify, collects log events, and forwards them either to Elasticsearch or Logstash for indexing.
The main configuration file will look like this:
filebeat.config:
  modules:
    path: ${path.config}/modules.d/*.yml
    reload.enabled: false

output.elasticsearch:
  hosts: ["${ELASTICSEARCH_HOST}:9200"]
  username: ${ELASTICSEARCH_USERNAME}
  password: ${ELASTICSEARCH_PASSWORD}

setup.dashboards:
  enabled: true

setup.kibana:
  host: "${KIBANA_HOST}:5601"
  username: ${ELASTICSEARCH_USERNAME}
  password: ${ELASTICSEARCH_PASSWORD}
And for the apache.yml we have:
- module: apache
  access:
    enabled: true
    var.paths: ["/log/access.log"]
  error:
    enabled: true
    var.paths: ["/log/error.log"]
Another option for this problem is to configure the containers to forward their Syslog data to the host, but this can be disabled if the attacker has root access, so it is not ideal.
Executaion logs
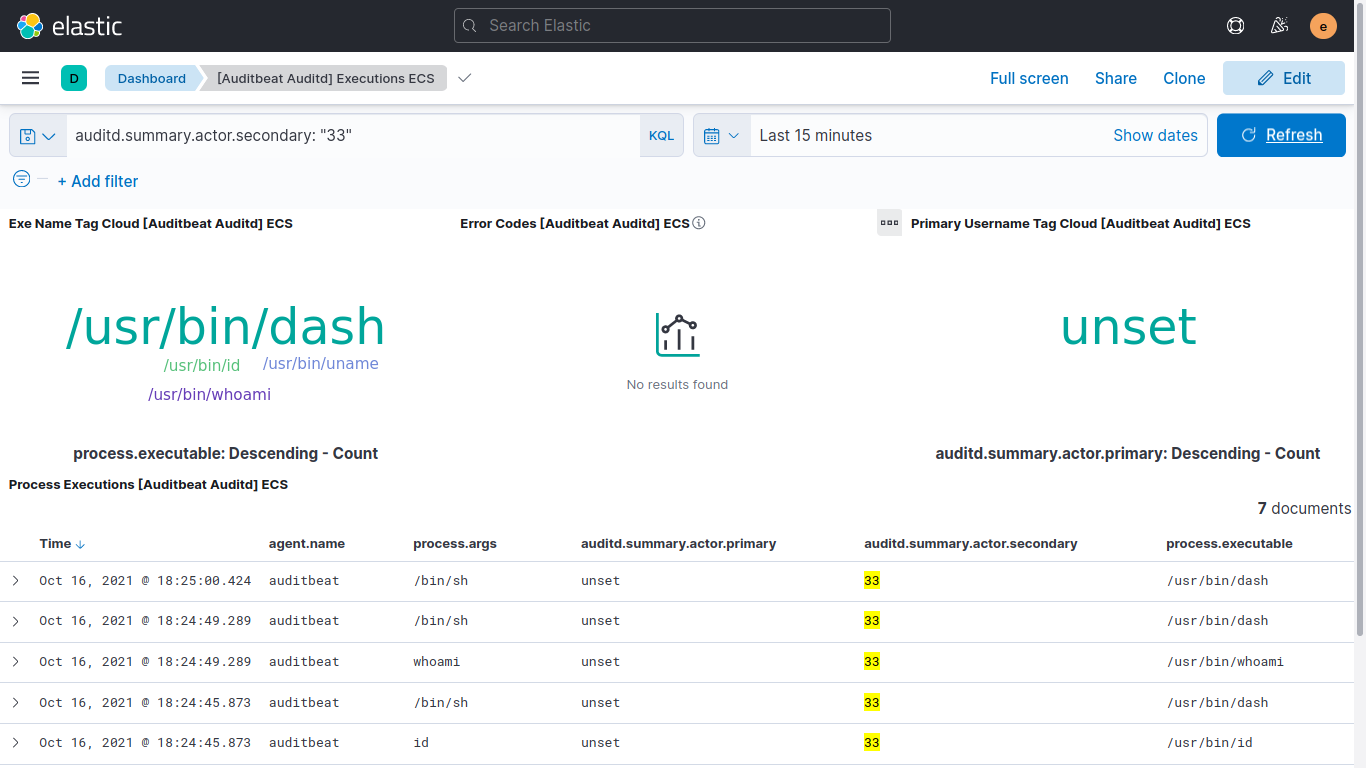
Docker runs on the same kernel as the host machine, so we can use kernel-level logging to see what is happening inside the container. An off-the-shelf solution is to use a Linux audit system and configure it to log execve and execveat system calls.
The Linux Audit system provides a way to track security-relevant information on your system. Based on pre-configured rules, Audit generates log entries to record as much information about the events that are happening on your system as possible.
The sad news is Linux audit system does not support kernel namespaces, so logs cannot be filtered for specific containers and the host machine. To make things easier, we defined a custom user inside the Dockerfile named www-data to filter out the related logs by this user.
USER www-data
To log the execution actions, we will use Auditbeat:
Auditbeat is a lightweight shipper that you can install on your servers to audit the activities of users and processes on your systems. For example, you can use Auditbeat to collect and centralize audit events from the Linux Audit Framework. You can also use Auditbeat to detect changes to critical files, like binaries and configuration files, and identify potential security policy violations.
The Auditbeat configuration file will look like this:
auditbeat.modules:

- module: auditd
  audit_rules: |
    -a always,exit -F arch=b64 -S execve,execveat -k exec

output.elasticsearch:
  hosts: ["${ELASTICSEARCH_HOST}:9200"]
  username: ${ELASTICSEARCH_USERNAME}
  password: ${ELASTICSEARCH_PASSWORD}

setup.dashboards:
  enabled: true

setup.kibana:
  host: "${KIBANA_HOST}:5601"
  username: ${ELASTICSEARCH_USERNAME}
  password: ${ELASTICSEARCH_PASSWORD}
Putting it all together
At this point, we have an ELK stack set up and running, Kibana dashboards ready to visualize the logs, a vulnerable container prepared to be exposed on the internet, a Filebeat instance ready to capture HTTP logs, and an Auditbeat instance to capture executed commands.
We can create a simple docker-compose.yml file to deploy the honeypot as fast as possible and make things much more manageable. To install the docker-compose, take a look at here!.
Content of the docker-compose.yml will be something like this:
version: "3.8"
services:
  honeypot:
    build: ./
    hostname: "honeypot"
    networks:
      - honeypot
    ports:
      - "80:8080"
    volumes:
      - logs:/var/log/apache2/
      - $PWD/httpd.conf:/usr/local/apache2/conf/httpd.conf

  auditbeat:
    image: docker.elastic.co/beats/auditbeat:7.15.0
    hostname: "auditbeat"
    user: root
    pid: host
    cap_add:
      - AUDIT_CONTROL
      - AUDIT_READ
    networks:
      - honeypot
    volumes:
      - auditbeat:/usr/share/auditbeat/data
      - $PWD/auditbeat.yml:/usr/share/auditbeat/auditbeat.yml:ro
    environment:
      - ELASTICSEARCH_HOST=elk.host # Change
      - KIBANA_HOST=kibana.host # Change
      - ELASTICSEARCH_USERNAME=elastic # Change
      - ELASTICSEARCH_PASSWORD=changeme # Change
    command: ["--strict.perms=false"]
    depends_on:
      - honeypot

  filebeat:
    image: docker.elastic.co/beats/filebeat:7.15.0
    hostname: "filebeat"
    user: root
    networks:
      - honeypot
    volumes:
      - filebeat:/usr/share/filebeat/data
      - $PWD/filebeat.yml:/usr/share/filebeat/filebeat.yml
      - $PWD/apache.yml:/usr/share/filebeat/modules.d/apache.yml
      - logs:/log/:ro
    environment:
      - ELASTICSEARCH_HOST=elk.host # Change
      - KIBANA_HOST=kibana.host # Change
      - ELASTICSEARCH_USERNAME=elastic # Change
      - ELASTICSEARCH_PASSWORD=changeme # Change
    command: ["--strict.perms=false"]
    depends_on:
      - honeypot

networks:
  honeypot:

volumes:
  auditbeat:
  filebeat:
  logs:
To bring up the honeypot stack, run the following command:
docker-compose up -d
That’s it :). Now, we can trace the logs with the help of Kibana and some beautiful dashboards.
Auditbeat executions Dashboard:
Filebeat Apache access and error logs dashboard:
Conclusion
We can build interactive honeypots for a variety of vulnerabilities in such a short period of time using containers. The ELK stack additionally provides us with some tools to gather valuable logs, manage records easier, and visualize them for better understanding. Spending time and effort, researchers can build honeypots to trace active threats and threat actors, such as miners, and share attack knowledge with other researchers. The information can be used to create threat feeds with a low likelihood of false positives. Additionally, engineers can use honeypots as a decoy system inside of an organization.
The project has been shared on Github. You can use it as a starting point. I hope you find it useful.
You’re more than welcome to share your thoughts and ideas. Feel free to ping me if you have questions about this topic.
Enjoy!
